
How to Run Your First Geo-Grid Scan Step by Step

Your first geo-grid scan takes about ten minutes of setup and answers a question no single rank check can, where, exactly, does this business show up on the map? This walkthrough covers the whole path, what to pick, what to ignore, and what your first map will look like.
Step 1, pick one business and one keyword
Resist the urge to scan everything at once. For your first scan, choose the following.
- One business, yours, or your client’s. You need its exact address.
- One keyword, the search a customer actually types when they’re ready to buy. “emergency plumber,” “personal injury lawyer,” “home renovation.” Not a brand name, nobody searches for you by name from across town.
If you’re stuck between candidates, pick the keyword with the most revenue attached, not the biggest search volume.
Step 2, choose the grid size and spacing
The grid is how many points you’ll measure; spacing is how far apart they are. Quick orientation is below, and there’s a full decision table in our grid size explainer.
- 5x5 (25 points), a single neighborhood or dense urban market.
- 7x7 (49 points), the sensible default for most local markets.
- 9x9 (81 points), suburbs and service-area businesses covering a wider territory.
Pair the grid with spacing that matches the market, 0.5-mile spacing for dense cities, 1–2 miles for suburban or rural coverage.
GeckoGrid also lets you pick the grid’s shape. Square is the classic N×N layout. Hexagon and circle cover a round market with fewer wasted corner points, so they are listed by point count instead: a Hexagon 7 is 37 points and a Circle 7 is 39. The three presets in the New Project form (Local, Standard, and Wide) set a sensible size and spacing in one click, and Standard, 7 at 1000m, is the usual choice for ongoing client work.
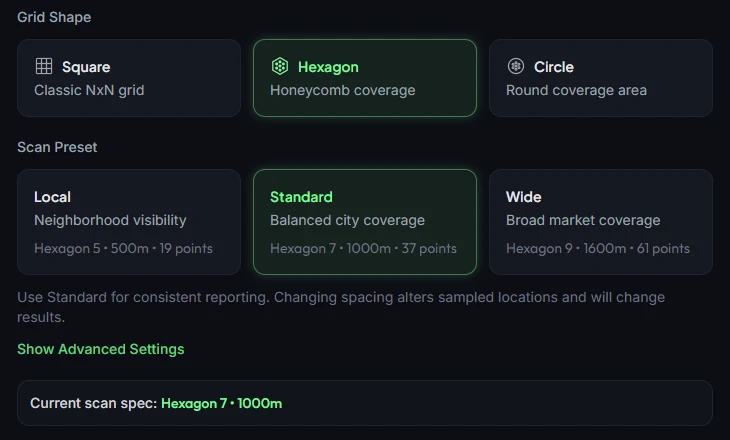
One rule to lock in now. Whatever you choose, you’ll keep for every future scan of this project. Trend comparisons only work between identical grids.
Step 3, set the center point
For a storefront business, the center is the business address, Google’s proximity weighting radiates from where the searcher stands, and most of your customers start near the middle of your market.
For a service-area business, center the grid where your customers are densest, not where your truck parks. If you serve three suburbs from a home address, the grid should cover those suburbs. Our service-area business guide covers this in depth.
Step 4, run the scan
With the project created, open it and click Scan all keywords, or Scan one keyword to pick a single term. A local scan checks the live results from each grid point at a deliberately human pace, because human-paced requests return honest results; it takes a few minutes for a typical grid. An API scan through DataForSEO comes back in seconds.
You don’t need to watch it. The project page shows progress in its action bar, so start the scan, keep working, and come back to the map.
Step 5, read your first heatmap
The finished scan colors every point by where the business ranked.

Three things to look at first.
- The shape of the green. Strong center fading outward is healthy. A dead zone in one direction is a lead worth chasing.
- Your average rank (top right of the map) as the baseline number for future comparisons. It counts any point where you weren’t found as 20, so it can’t flatter you.
- One weak point, opened. Click any colored point to see the top 20 results there, that’s the list of businesses beating you in that spot, with their ratings and review counts.
That’s the diagnostic loop in miniature, the map shows where you’re weak, and the point details show who is strong there.
Step 6, schedule the next scan
The first scan is a baseline, it only becomes intelligence when you repeat it on the same grid. The project already remembers the grid, center, and keywords, so click + Schedule recurring scans in its action bar and pick a cadence: weekly for competitive keywords, monthly for quieter ones, per our cadence guide.
Every scan lands in the project’s Scan History, which shows each keyword’s latest map rank, the change since the previous scan on the same grid, and a trend line. That’s where the next four weeks of data turn into a story.
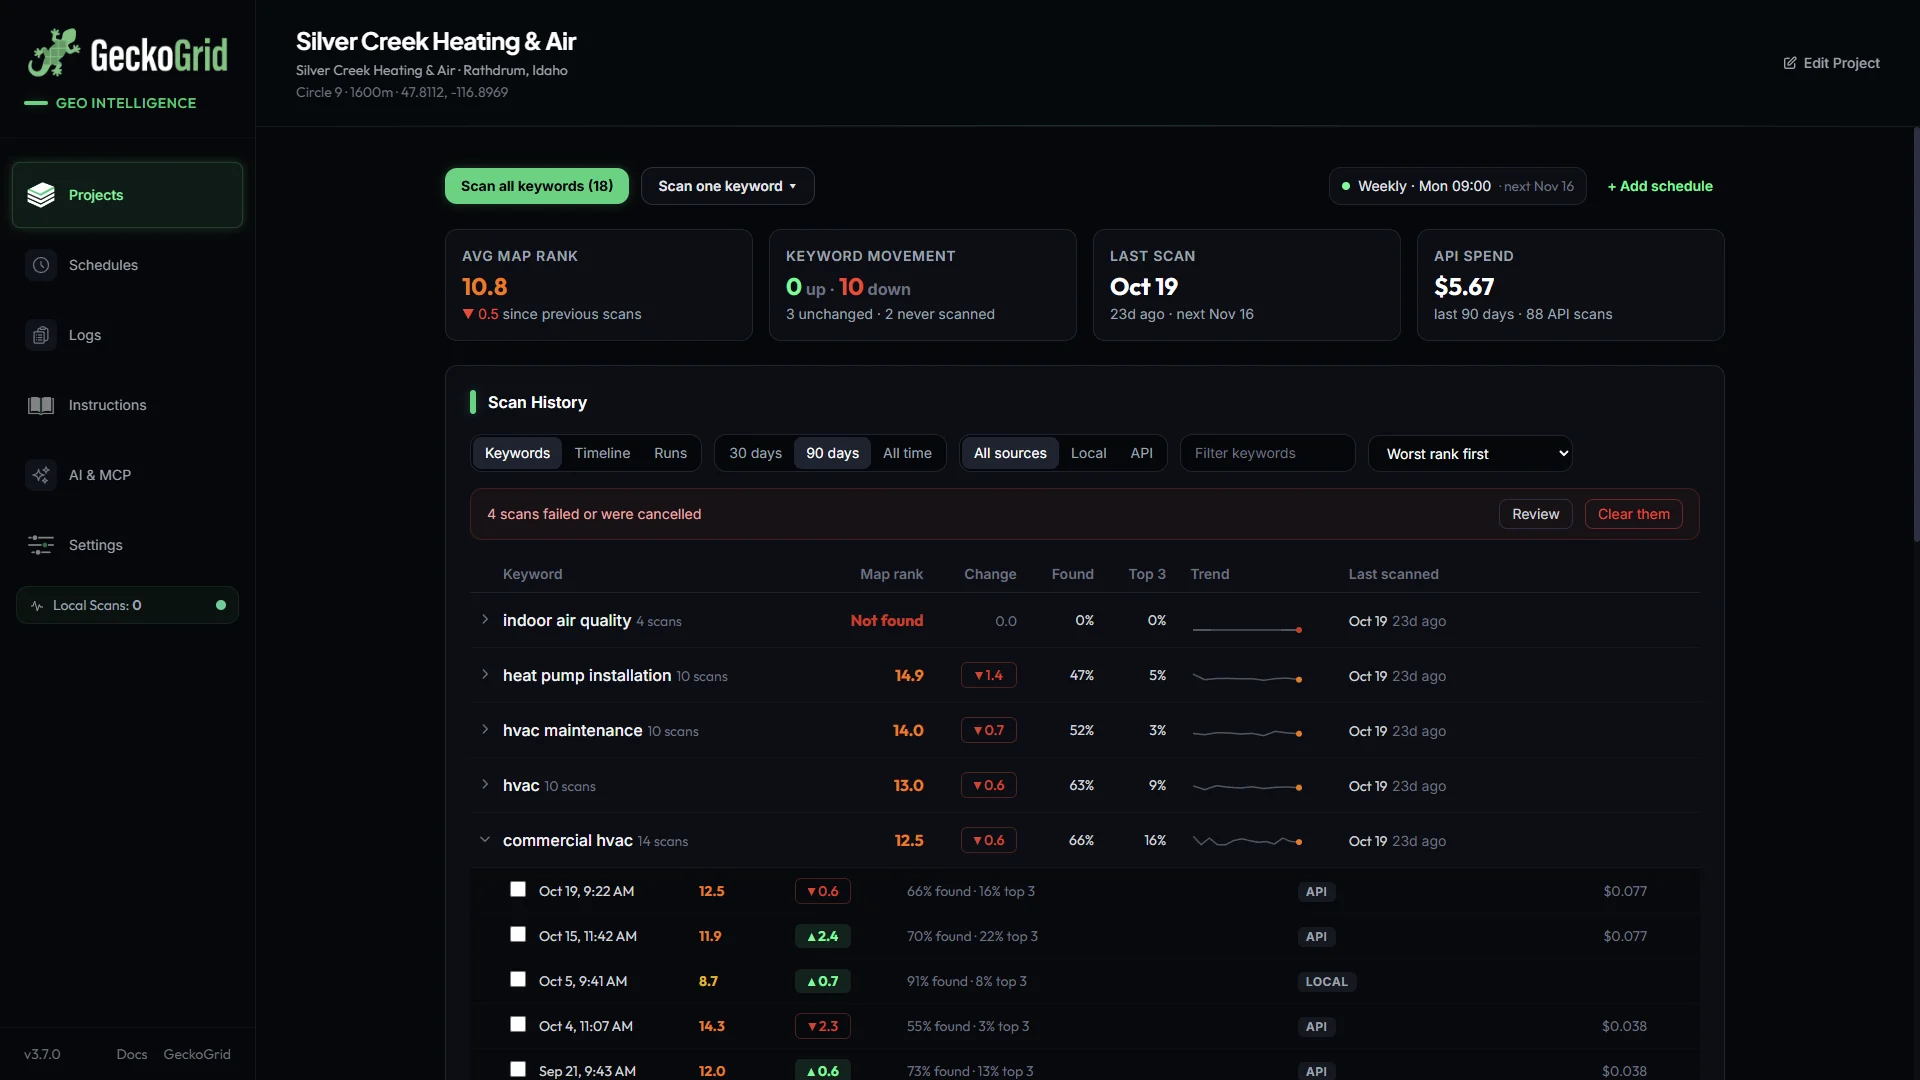
Four weeks from now you’ll have something no rank tracker screenshot can give you, a trendline map that shows whether your local SEO is moving the needle, and in which neighborhoods.
Keep reading
Geo-Grids for Service-Area Businesses, Tracking Without a Storefront
Plumbers, HVAC, mobile detailers, how to run geo-grid scans when customers never visit your address, from centering the grid to judging coverage instead of center rank.
Geo-Grid Sizes Explained, From 3x3 to 9x9
Which grid size fits which market? A practical guide to geo-grid density and spacing for neighborhoods, cities, and service-area businesses, with a decision table.
How Often Should You Run Geo-Grid Scans?
Daily, weekly, or monthly? How to pick a geo-grid scan frequency per client tier, why consistency beats volume, and how to automate the schedule.