
How to Read a Geo-Grid Heatmap and Decide What to Do Next

You ran a geo-grid scan. The map lit up: green near the office, a band of yellow around it, a cluster of red to the northeast. Now what?
A heatmap without interpretation is just a pretty picture. This is the framework we use to turn grid data into decisions. It covers what each color means, which patterns matter, and what to do about each one.
What you’re actually looking at
A geo-grid scan places a grid of points around a business and searches Google Maps from each one. Every point records where that business ranked for one keyword, and the number inside each circle is that rank. GeckoGrid colors them on a four-step scale:
- Green (1 to 3). You’re in the top three, the results most searchers see and tap.
- Yellow (4 to 10). On the first page of results, but below the top three. On a phone, that usually means below the fold.
- Orange (11 to 15). Page-two territory. Technically visible, practically not.
- Red (16 or worse, or not found). You aren’t competing at that point. A “20+” means the business wasn’t in the top 20 at all.
One keyword, one scan, one map. A 7x7 grid gives you 49 of these measurements across the market, and a 9x9 gives you 81: far more honest than the single ranking most trackers report from one location. The average rank in the corner of the map counts every not-found point as 20, so it falls when you disappear from part of the grid instead of quietly ignoring those points.
Click any circle to see the full top 20 at that point. That’s the evidence behind the color: who outranked you there, and with what rating and review count.

The five patterns that matter
1. Strong center, weak edges
The most common healthy pattern. Proximity is the strongest local ranking signal, so fading at the edges is natural. Don’t panic, compare against last month’s scan instead. If the green zone is growing, your work is landing.
2. A dead zone in one direction
You rank everywhere except one quadrant. That’s usually a dominant competitor’s home turf. Study that competitor directly, their categories, reviews, and pages. Then scan them on the same grid and look for their weak edges, because you enter a strong market from its borders, not its center.
3. Uniformly weak across the whole grid
If you’re barely visible anywhere, the problem isn’t geographic, it’s foundational. Categories, profile completeness, review volume, or site signals. Fix the Google Business Profile basics before spending anything on area-specific work. Scans will tell you when the foundation starts holding.
4. Patchy, competitive split
You and competitors trade cells unpredictably. This means the market is contested and proximity is the tiebreaker. Pick the clusters where you’re already competitive and reinforce those neighborhoods first, content, citations, and reviews targeted there. Winning adjacent cells is easier than flipping a rival’s stronghold.
5. Strong at the edges, weak at the center
Rare, and worth attention. If you rank miles away but not at your own address, something is off with how Google associates your profile with your location, an address or category issue, or even an indexing problem. Audit the profile itself before anything else.
Read trends, not snapshots
Rankings wobble day to day. A single scan is a snapshot; the trend is the signal. Keep your grid size and spacing consistent between scans, comparing a 5x5 to a 9x9 changes the density of the data, and you’ll read noise as movement.
Weekly scans separate signal from noise in competitive markets. Monthly is enough for quieter ones. What matters is that the only thing changing between scans is time.
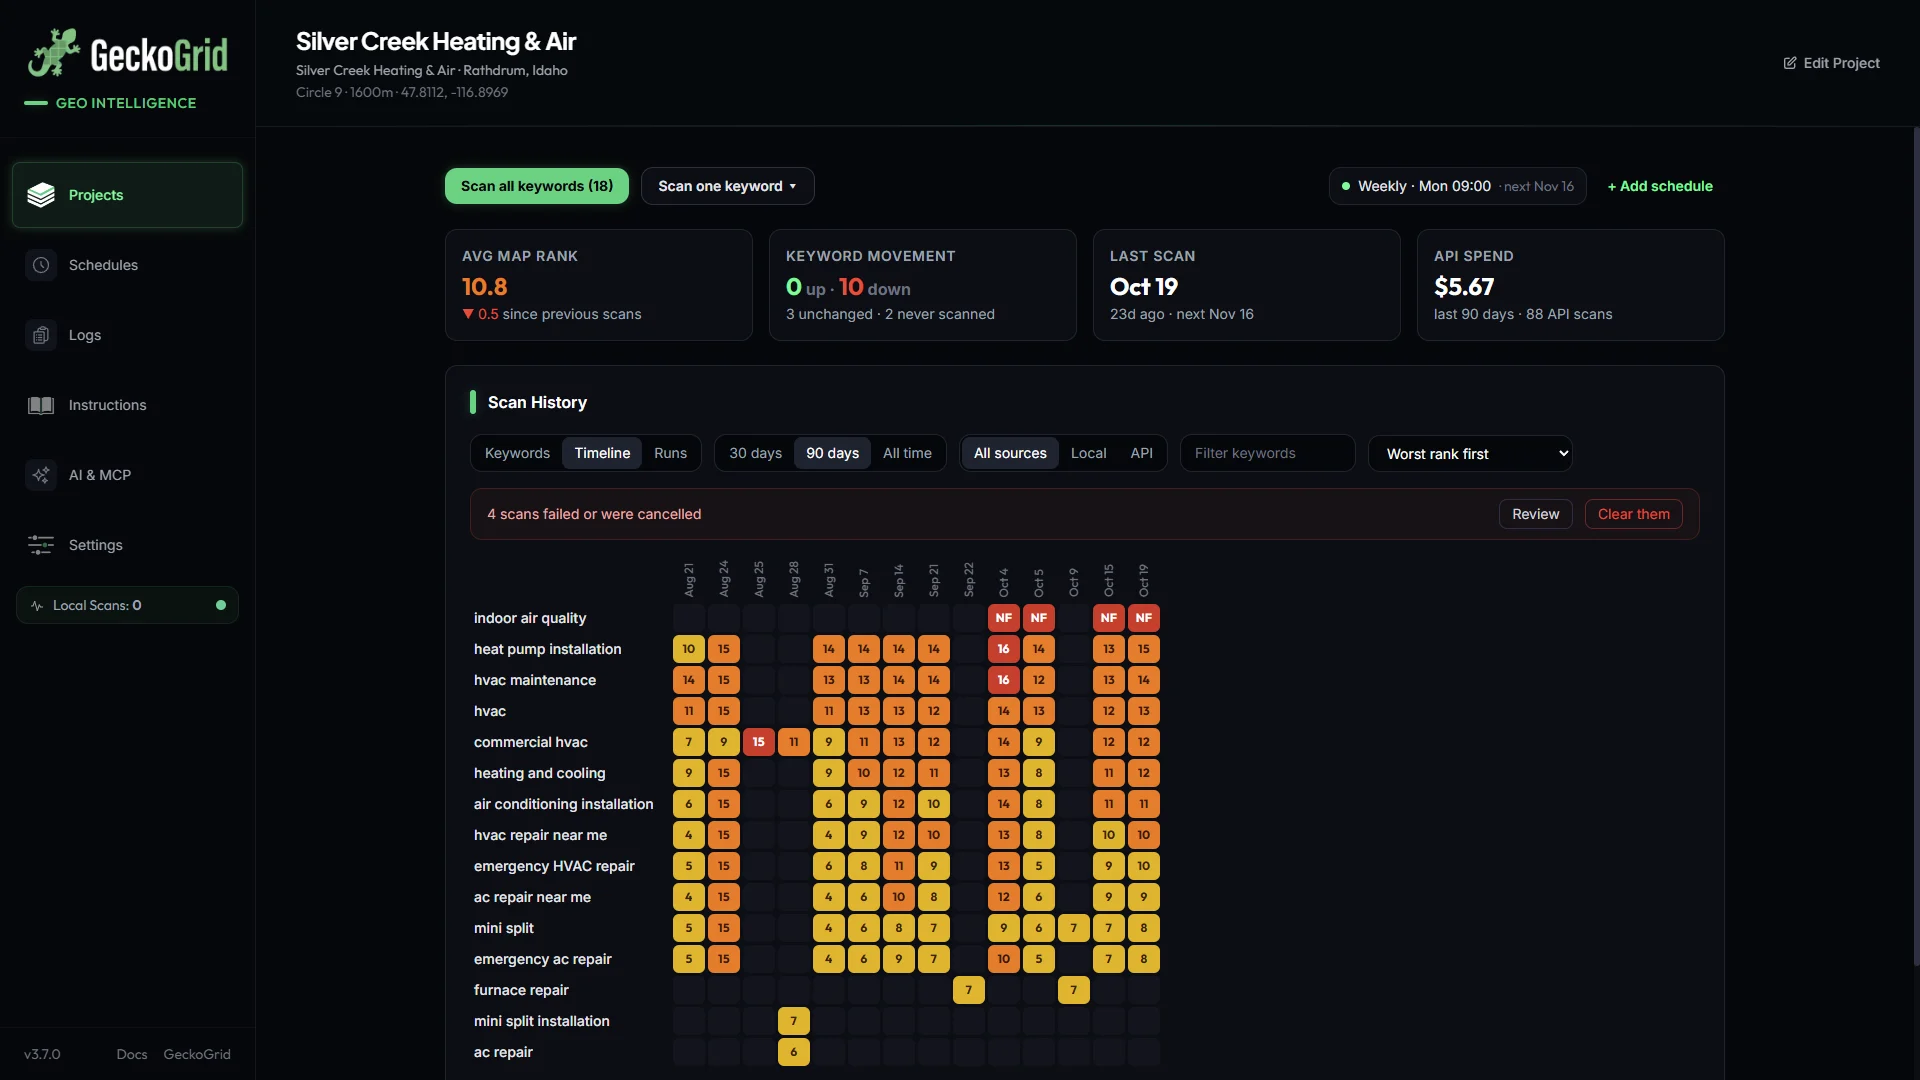
GeckoGrid’s Scan History enforces this for you. The change it shows for each keyword only compares scans on the same grid and the same source (local or API), and the Timeline view lays every keyword against every scan date in the same four colors, so a slipping keyword shows up as a row going from green to orange.
Read the competitors too
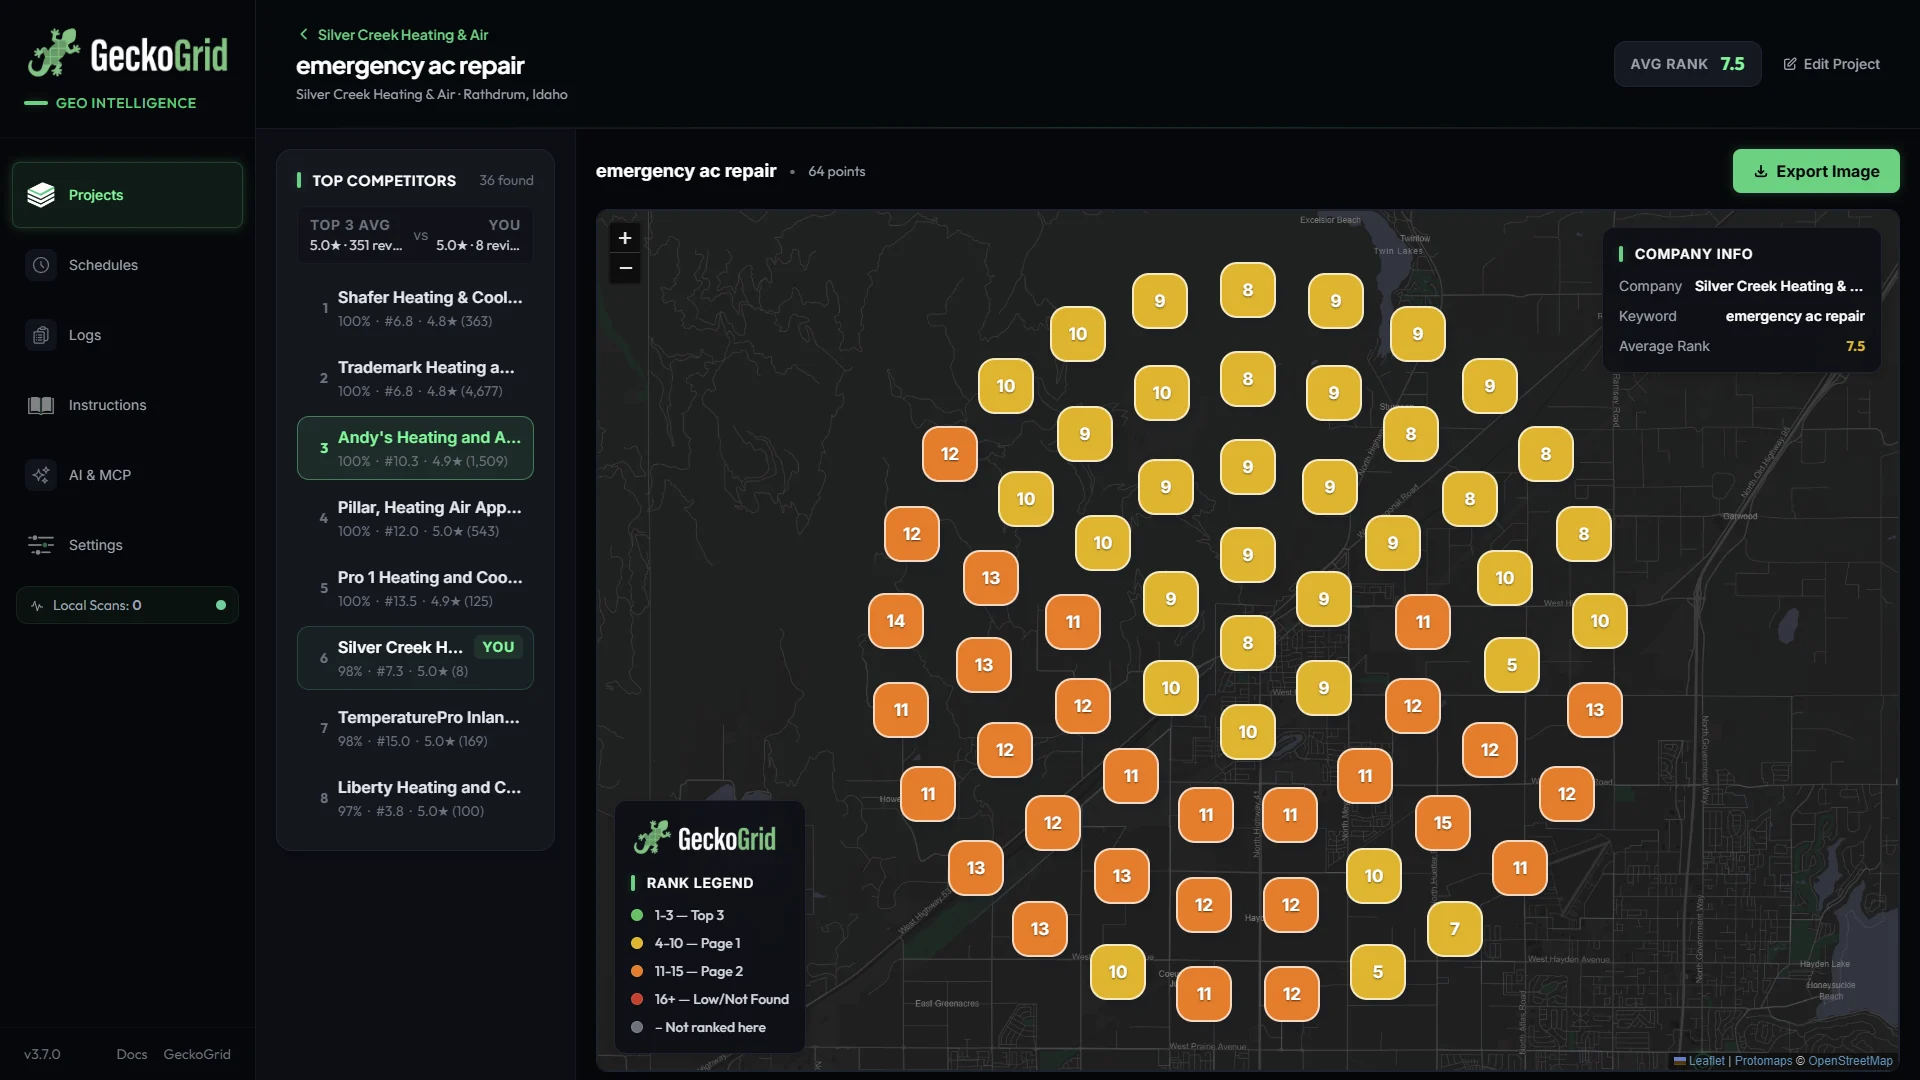
When one direction goes dark, open the competitor list beside the map and click the business that wins there. GeckoGrid redraws the same grid with their rank at every point, which turns “we’re weak in the northeast” into “this is whose territory the northeast is.”
Turn the map into a work order
The fastest way to act on a heatmap is simple. Divide it into quadrants, rank the quadrants by how many weak cells they contain, and treat the worst quadrant as this month’s project. One neighborhood, one competitor, one set of citations and content at a time.
That’s the real value of a geo-grid. It converts “our local SEO feels stuck” into “we don’t own the northeast, and here’s who does.”
Keep reading
How to Win Local SEO Clients With a Geo-Grid Prospect Audit
A practical prospecting workflow for agencies and freelancers: pick the right local businesses, scan them, turn the heatmap into a short audit with a fix plan, and send outreach that gets replies.
How to Track Google Maps Rankings Over Time Without Fooling Yourself
Most rank trends lie a little. How to track local Map Pack rankings over weeks and months so the change you report is real: one rank definition, identical grids, one engine, and the right views.
How to Track Local Competitors on Google Maps, Point by Point
Find out who actually outranks a business in the Google Maps local pack, where their territory starts and stops, and which gaps (reviews, rating, category, proximity) explain it, using geo-grid competitor data.