
How to Track Google Maps Rankings Over Time Without Fooling Yourself

A single geo-grid scan answers “where do we rank right now?” The question clients and owners actually care about is different: is it getting better, and by how much? That second question is where most local rank reporting quietly goes wrong, because a trend line inherits every inconsistency in the scans underneath it.
Here’s how to track Google Maps rankings over time so the movement you report is movement that happened.
Decide what “rank” means before you trend it
Every geo-grid tool shows some kind of average, and the definitions differ in a way that matters a lot more than people expect.
The common shortcut averages only the points where the business appeared. It sounds reasonable until you watch what it does when things go badly. Suppose a business ranks 4th at 30 points and isn’t found at the other 19. The found-only average is 4.0. Next month a competitor pushes it out of another 15 points, and the found-only average… is still around 4, maybe better, because the points it lost were its weakest ones. Visibility collapsed and the number didn’t flinch.
The fix is simple: count every point where the business wasn’t found as rank 20. Now a drop off the map drags the average down like it should. GeckoGrid uses that definition everywhere, on the heatmap and in Scan History, and calls it map rank.
Alongside it, track coverage directly:
- Found, the share of grid points where the business appears at all.
- Top 3, the share of points where it ranks 1 to 3. This is effectively Share of Local Visibility (we unpack the metric in what SoLV and visibility scores mean).
Map rank tells you direction. Top 3 tells you how much of the market can actually see you.
Freeze the grid
A trend only means something when the only variable is time. Change the grid size, spacing, shape, or center and the next scan measures a different patch of the world. Its average isn’t comparable to last month’s, even if it looks like it is.
So pick the grid once, per project, and leave it. If you genuinely need a wider view later (a client opens a second location, say), treat the first scan on the new grid as a fresh baseline instead of a data point on the old line. GeckoGrid flags this case automatically: when a keyword’s newest scan ran on a different spacing or point count than the one before, the change column reads Grid changed instead of a number.
Our grid size guide covers how to choose a grid you’ll be happy to keep.
Use one engine per trend
GeckoGrid can scan two ways: a local scan that runs Chrome on your own computer, and an API scan through DataForSEO. Both read the live results, but they don’t always return identical rankings for the same point at the same moment, a bit like two people searching from the same street corner on different phones.
That difference is small and usually harmless. It becomes a problem when you alternate engines from week to week, because the trend line starts zig-zagging with the source instead of the market. We saw exactly this on a real HVAC project: the same keyword read 15.8 on an API scan one day and 11.8 on a local scan the next, and neither number was wrong.
Pick an engine for each project’s routine scans. GeckoGrid compares each scan only with the previous one from the same source, and you can filter Scan History to Local or API when a project has both.
Keep the cadence boring
Weekly scans for competitive keywords and anything you’re actively working on; monthly for quiet markets. Run them on the same weekday at roughly the same hour, which is what a schedule is for. Rankings shift a little with time of day and day of week, and a consistent slot removes that noise from the comparison.
There’s a longer discussion in how often to run geo-grid scans, but the short version is that consistency beats frequency.
Read the trend in three views
Once the scans are consistent, the job is reading them quickly. GeckoGrid’s project page gives you the same data three ways, because each answers a different question.
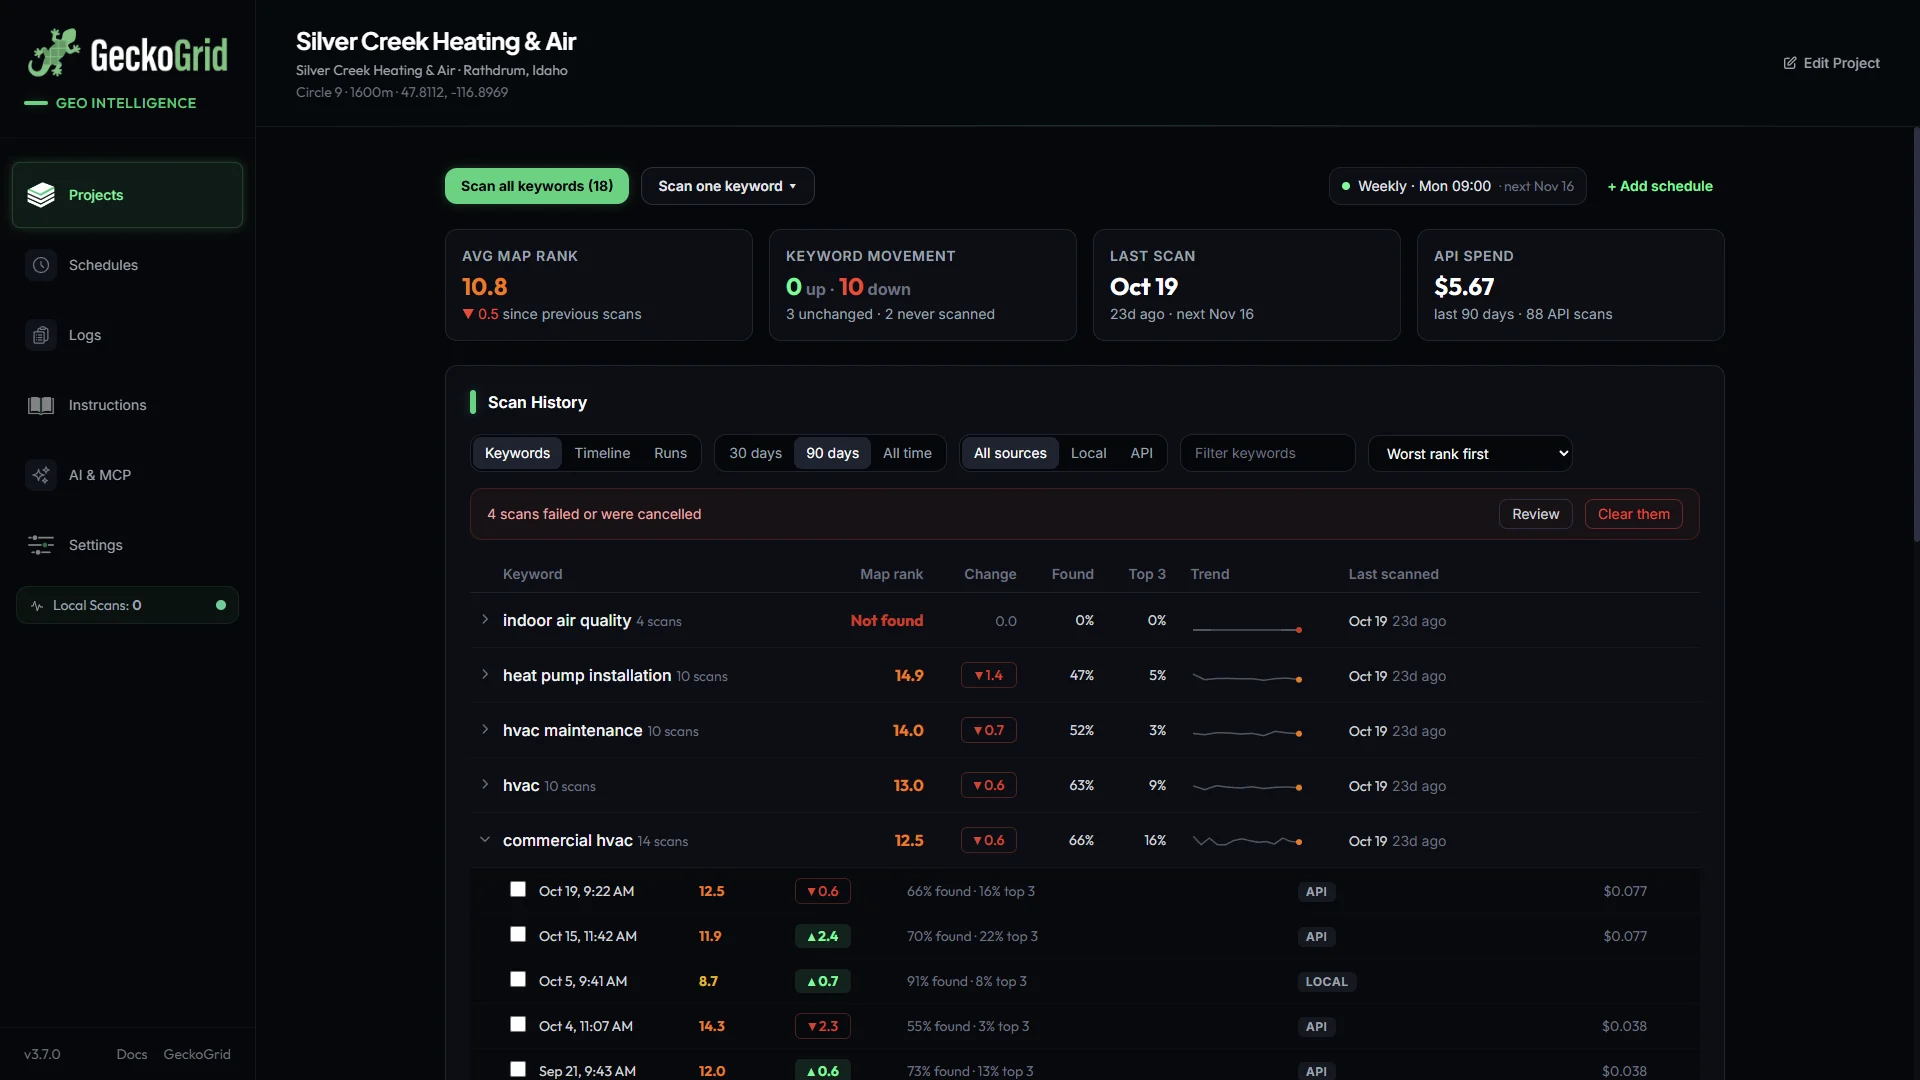
Keywords: what changed since last time? One row per keyword with its latest map rank, the change since the previous comparable scan, found and top 3 shares, a trend line on a fixed 1 to 20 scale, and when it was last scanned. Sort by Biggest drop on Monday morning and you’ve got your priority list.
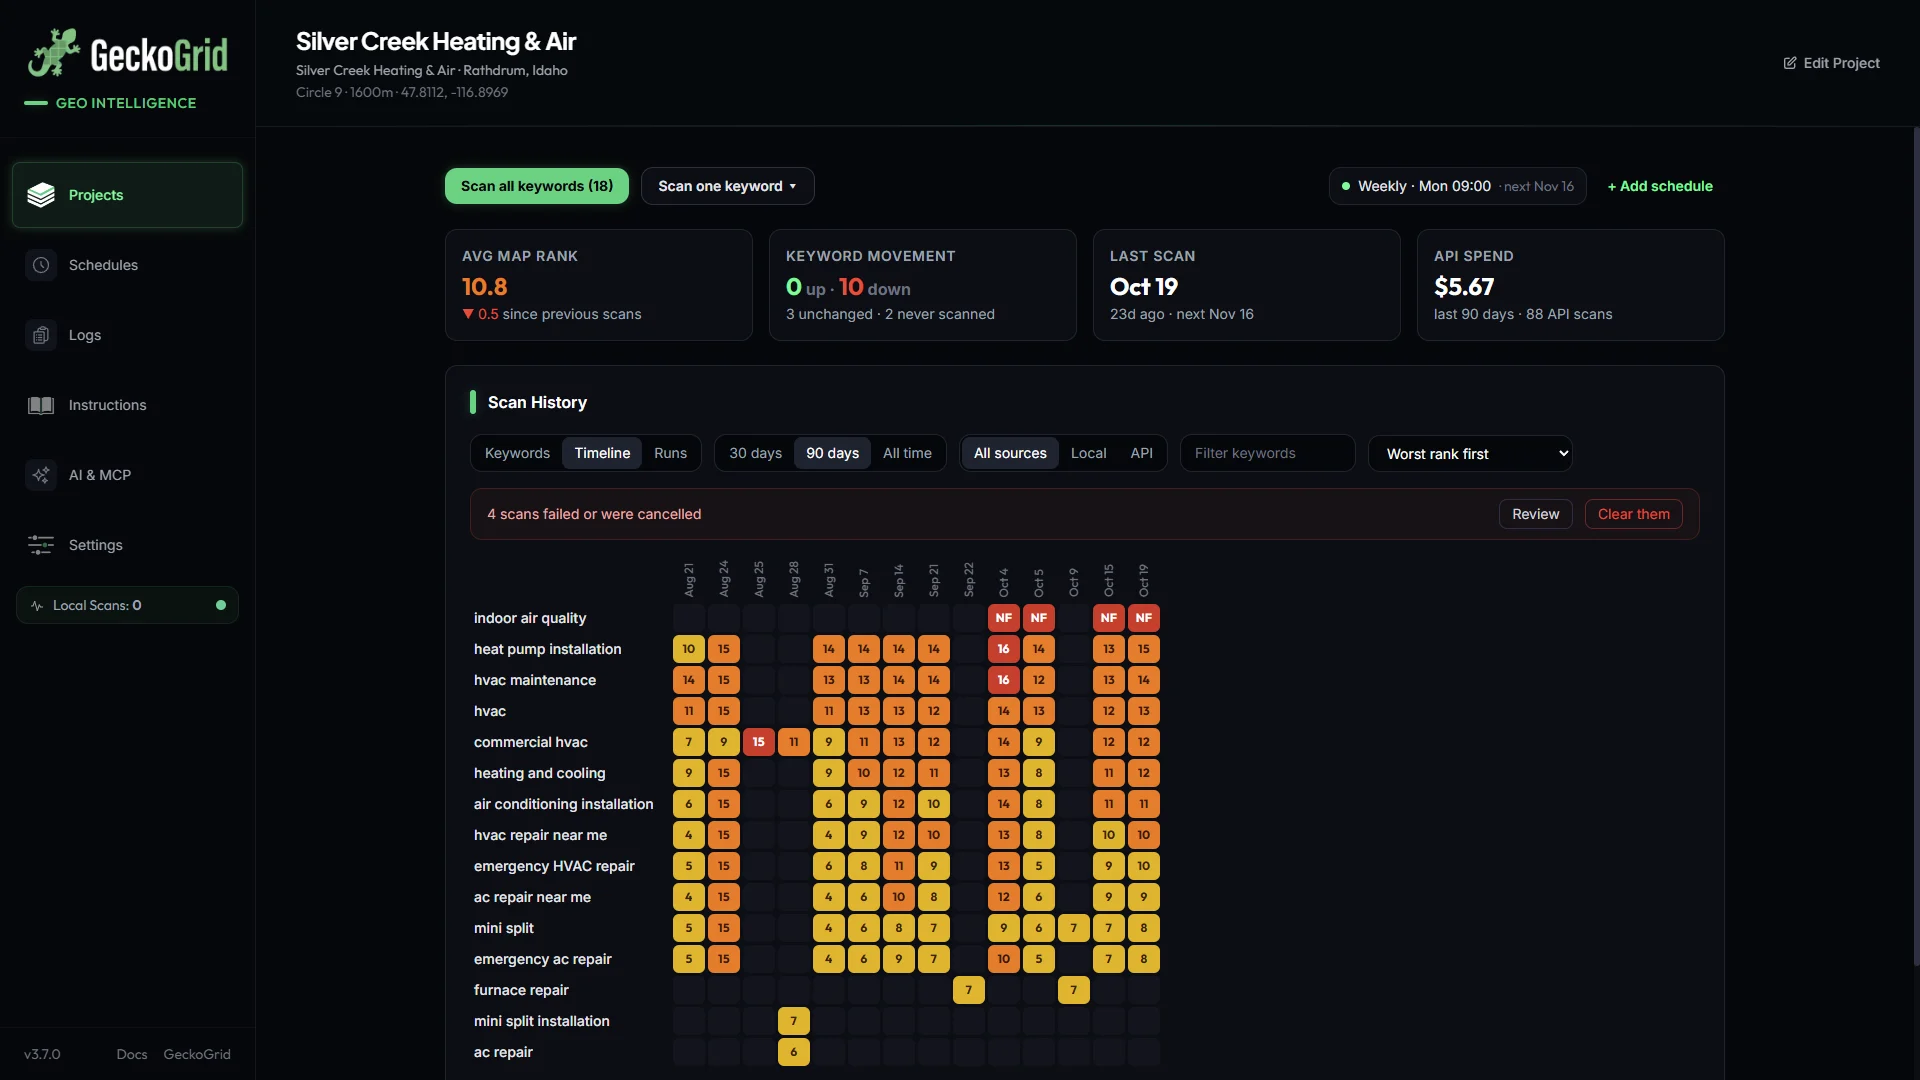
Timeline: which keywords are drifting? Keywords down the side, scan dates across the top, each cell colored by that day’s rank. A healthy project reads as rows that stay green or turn green. A slow leak reads as a row going from yellow to orange over six weeks, which is exactly the kind of decline a week-over-week number hides.
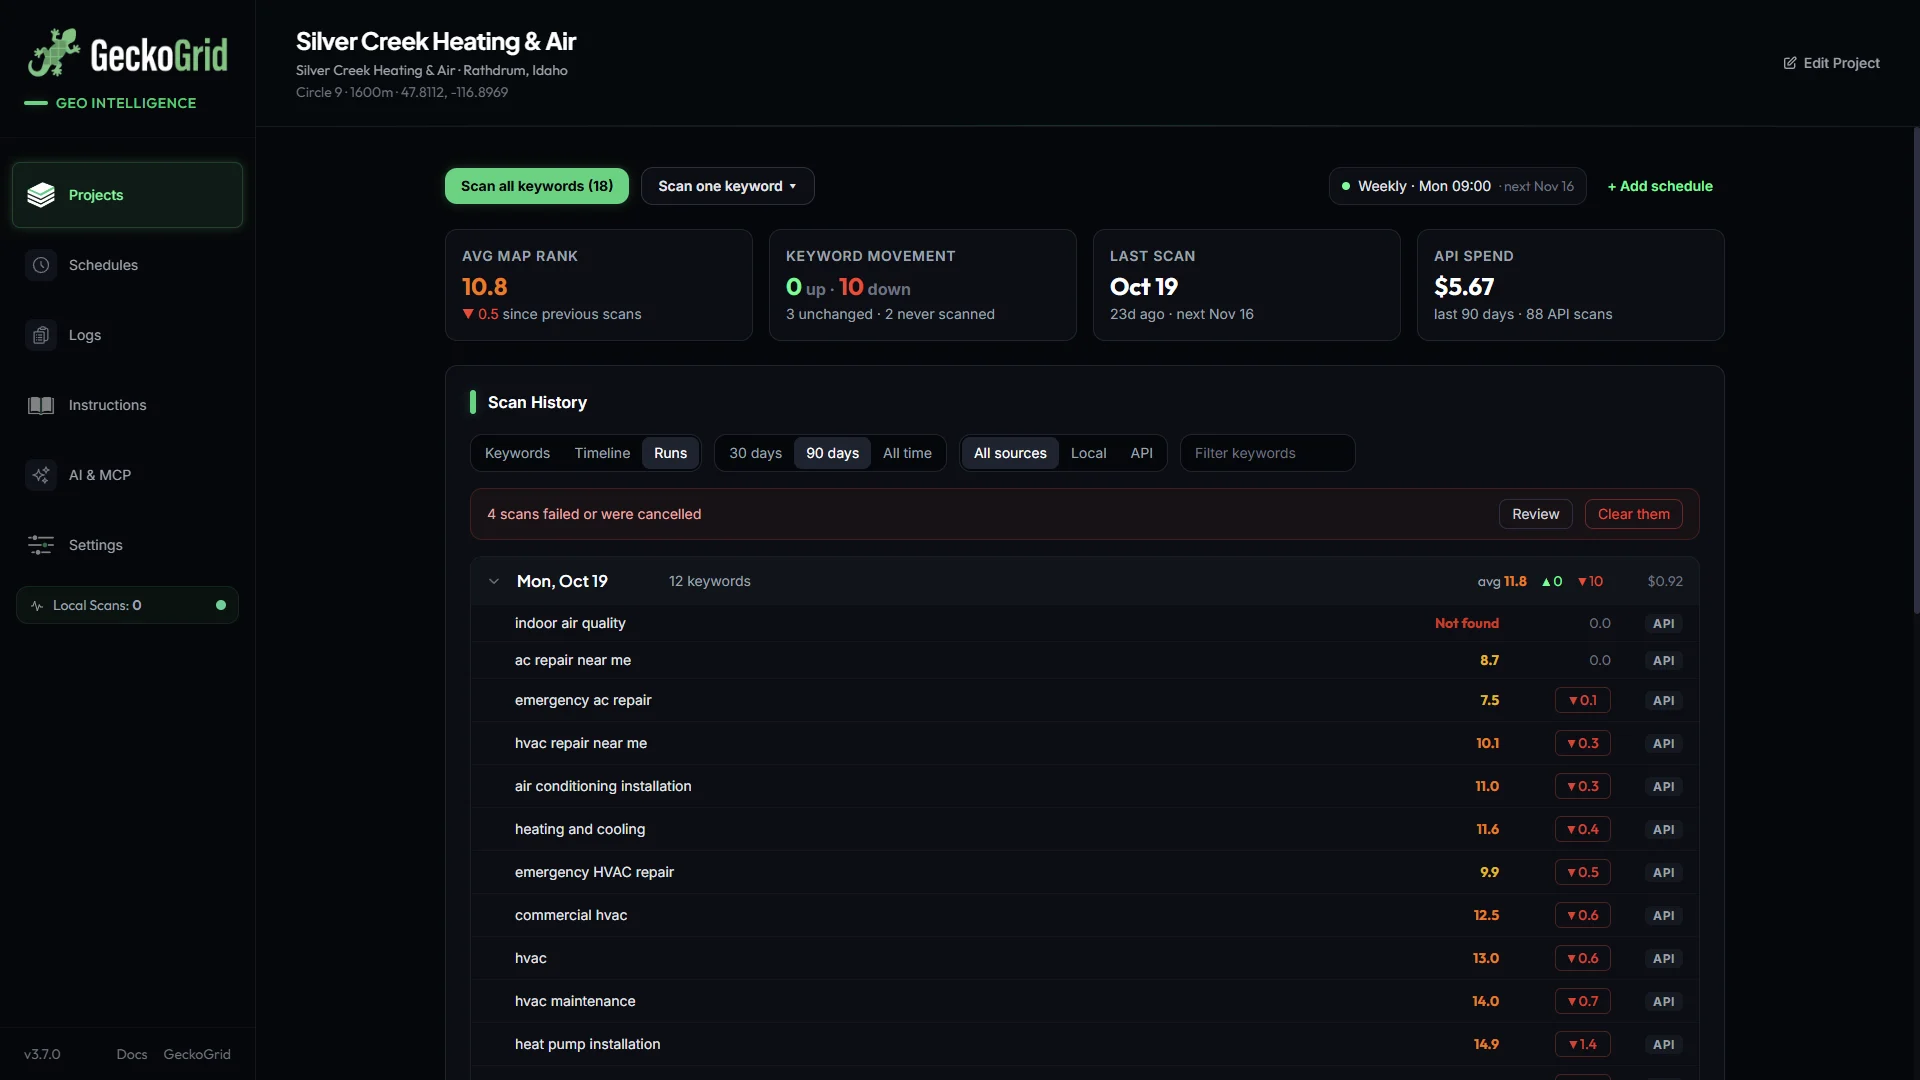
Runs: what did this scan day do? Scans grouped by day, each run showing how many keywords improved or dropped, the average rank, and the cost. It’s the view to open after a scheduled run, or the week after you shipped a batch of GBP changes.
What a real trend looks like
Small moves are normal. A keyword wobbling between 9.8 and 10.4 over a month isn’t telling you anything; that’s the market breathing. Movement worth acting on usually shows up in two of these at once:
- A change of a point or more in map rank that holds for two or more scans.
- A shift in top 3 share of several percentage points.
- The same direction across several related keywords (“ac repair”, “ac repair near me”, “emergency ac repair” all slipping together).
- A visible change in the heatmap’s shape: the green area shrinking from one side, for instance.
When you see one, open the latest heatmap and the competitor list for that keyword. A slide in one direction almost always has a name attached, and tracking competitors on Google Maps walks through finding it.
A practical routine
Here’s the loop we’d set up for a typical client:
- One project per location, one fixed grid, the 3 to 6 keywords tied to revenue.
- A weekly schedule on the same morning, one engine.
- Monday: sort Keywords by biggest drop, open anything that fell more than a point, check the heatmap and competitors.
- Monthly: screenshot the Timeline for the report, and pair it with before-and-after heatmaps of the two keywords that moved most.
Do that for a quarter and you’ll have something better than a rank report. You’ll have a record of which work moved which keyword in which part of town, and that’s what keeps clients renewing.
Frequently asked questions
How often should I scan to track Google Maps rankings over time?
Weekly for competitive keywords and active campaigns, monthly for stable markets. The cadence matters less than keeping it steady: the same grid, the same keyword, and roughly the same day and time each run.
Why does my average rank improve when I'm losing visibility?
Because many tools average only the grid points where you were found. Drop out of the top 20 across half the grid and those points vanish from the math, so the average looks better. Count every not-found point as 20 and the number moves the right way.
Can I compare a 7x7 scan with a 9x9 scan?
Not directly. A different size or spacing samples different locations, so the averages measure different areas. Treat a grid change as a new baseline and compare forward from there.
Should I mix local scans and API scans in one trend?
Keep them apart. The two engines can return slightly different results for the same point, so alternating between them makes a trend line wobble for reasons that have nothing to do with your SEO.
Keep reading
How to Win Local SEO Clients With a Geo-Grid Prospect Audit
A practical prospecting workflow for agencies and freelancers: pick the right local businesses, scan them, turn the heatmap into a short audit with a fix plan, and send outreach that gets replies.
How to Track Local Competitors on Google Maps, Point by Point
Find out who actually outranks a business in the Google Maps local pack, where their territory starts and stops, and which gaps (reviews, rating, category, proximity) explain it, using geo-grid competitor data.
How to Present Heatmaps to Clients for Local SEO Reporting That Retains
Turn geo-grid scans into client reports that survive procurement meetings, the five-slide structure, which numbers to lead with, and the mistakes that make heatmaps feel like decoration.