
What Do SoLV and Visibility Scores Actually Mean?
A heatmap shows the story. Metrics score it. If you report on local SEO, or decide budget based on it, you need to know what those numbers actually measure, because averaging them wrong makes great months look flat and lucky months look like progress.
SoLV, Share of Local Visibility
SoLV answers one question. Of all the grid points, in what share are you in the top 3?
A business ranking #1–3 at 30 of 81 points has a SoLV of roughly 37%. The number’s power is its bluntness, top-3 is where the clicks are, so SoLV tracks the only real estate that matters. It also makes an excellent north-star metric across time. Same grid, same keyword, SoLV last month versus this month is the cleanest “are we winning?” answer in local SEO.
Average Rank Position (ARP)
ARP averages your position across every point where you appeared. It’s a finer instrument than SoLV, it catches improvement from #14 to #9 that SoLV ignores entirely, but handle it with care.
- Averaging across points where you ranked #1 and points where you ranked #19 produces a number (#10) that describes neither situation.
- If you drop out of the top 20 at some points, whether those points count as “20+” or are excluded changes the arithmetic substantially. Excluding them is the dangerous choice: lose half the grid and your average improves. GeckoGrid counts every not-found point as 20 for exactly this reason.
Use ARP to see direction and texture, “we improved across the southern half”, not as a headline number. SoLV headlines; ARP explains.
How to read the two together
The pairs tell distinct stories.
- SoLV up, ARP stable, you cracked the top 3 in new areas. Unambiguously good.
- ARP up, SoLV flat, you’re climbing from invisible toward visible, but not into the pack yet. Progress; keep going.
- SoLV down, ARP stable, a competitor displaced you somewhere specific. Find the cells; it’s usually one rival and one neighborhood.
- Both down uniformly, foundational issue or a Google update. Check the profile before blaming the strategy.
Reporting metrics without lying with them
Three rules for client reporting.
- Show the map next to the number. A SoLV of 41% means nothing to a client until the 81-cell map is beside it. The map explains; the number measures.
- Compare like with like. Same grid, same keyword set, same cadence, otherwise deltas are fiction.
- Trend over snapshot. One scan is a photo; four is a movie. Every client deck should show the last four scans’ metrics as a line, not this week’s as a bar.
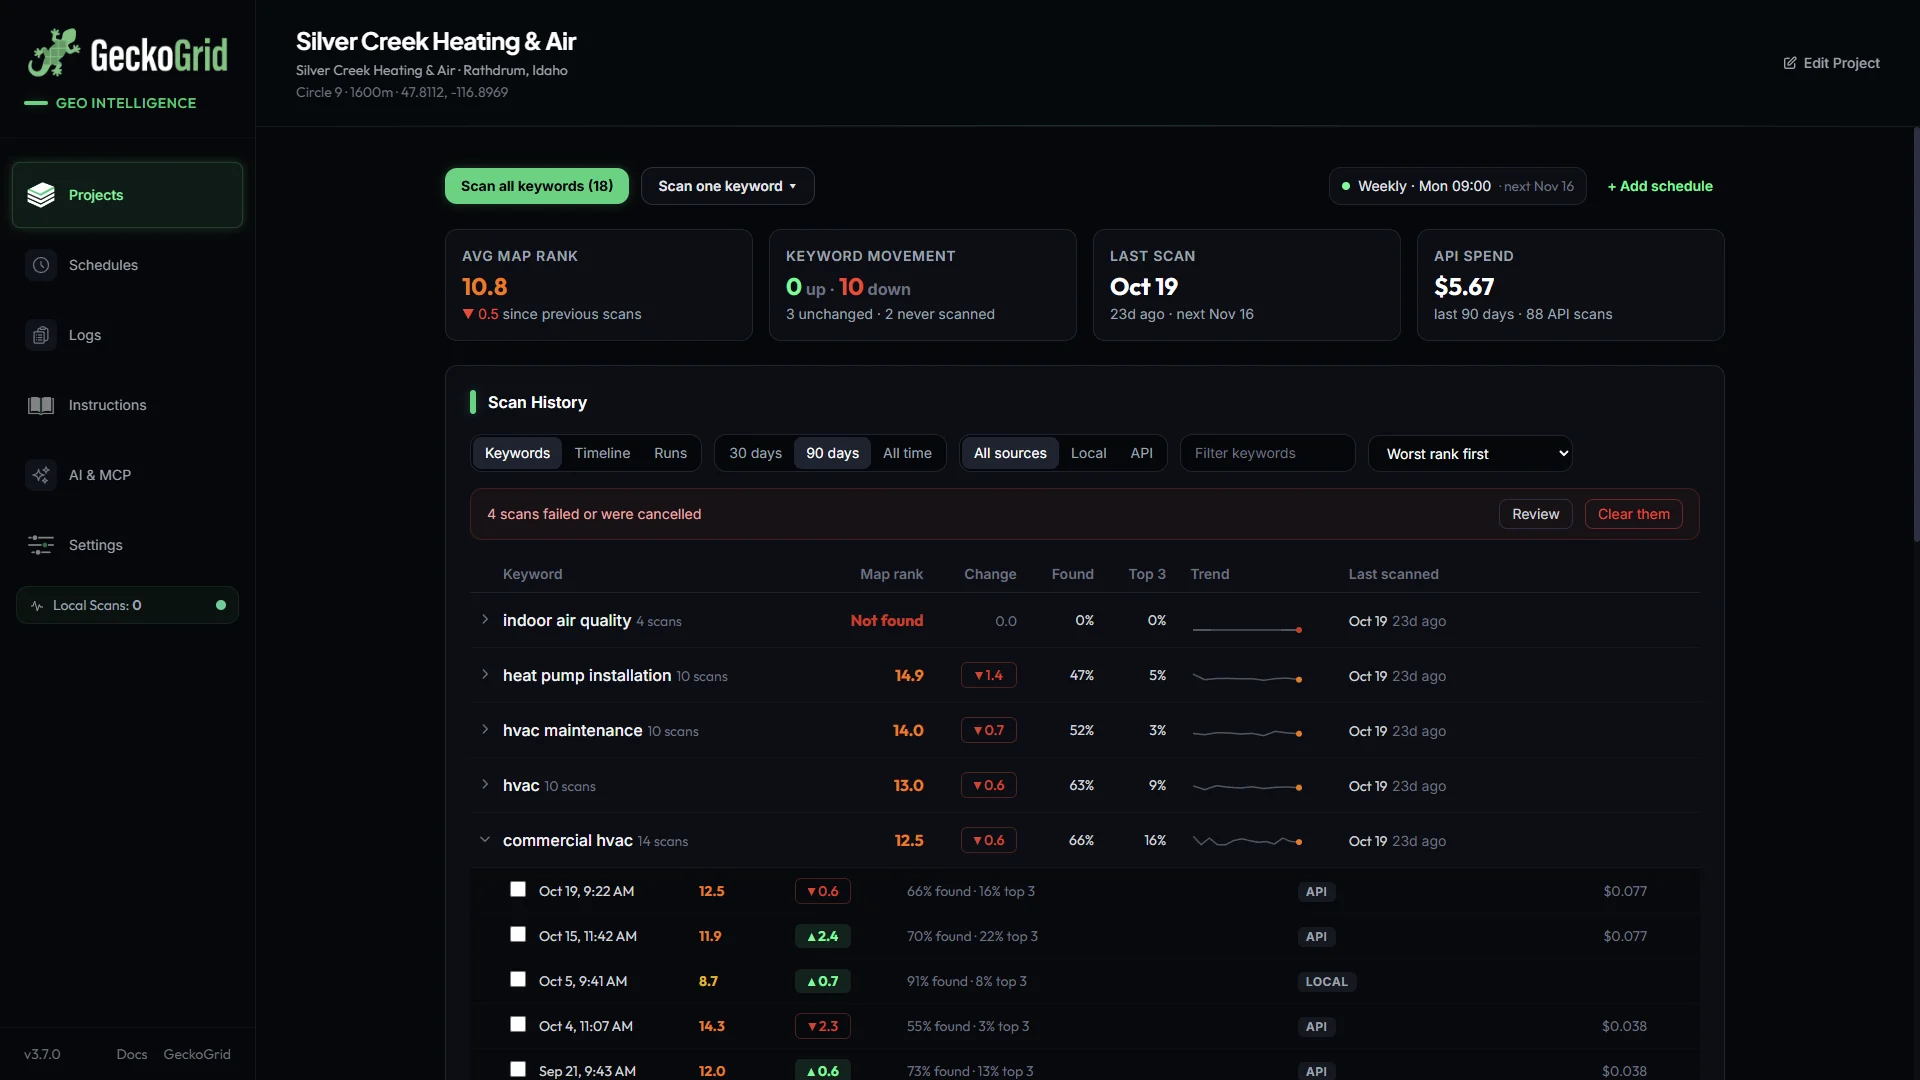
In GeckoGrid, the project page’s Scan History puts these side by side for every keyword. Top 3 is the share of grid points ranked 1 to 3, which is SoLV for that keyword. Map rank is the average across every point with not-found points counted as 20, so dropping off the map can never flatter the number. The Change column only compares scans on the same grid and the same source, which enforces rule two for you, and the trend lines enforce rule three.
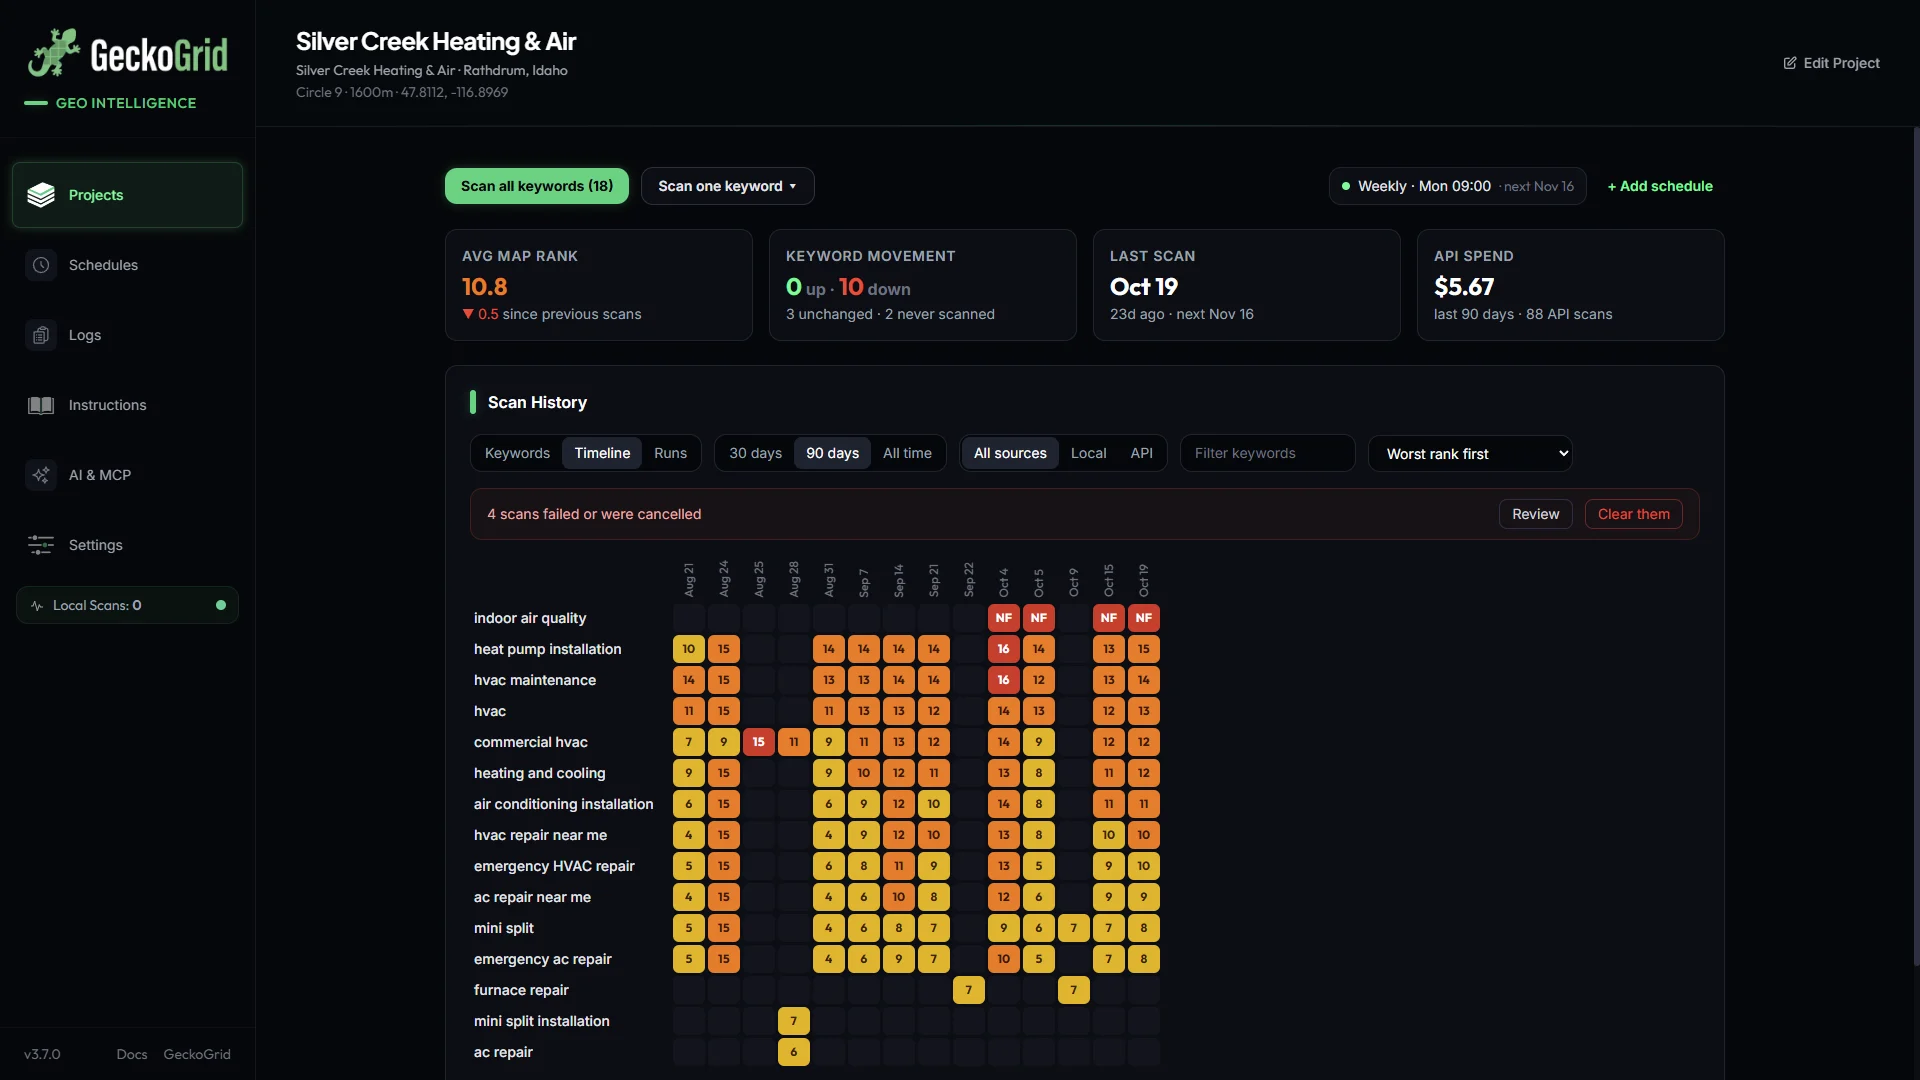
Competitor Intelligence adds per-keyword leaderboards on each scan, so the metric conversation (“whose SoLV is moving?”) happens on the same screen as the maps.
The metric that matters most
If you take one thing away, take this, SoLV per keyword, trended on an identical grid, is the closest thing local SEO has to a share price. Everything else exists to explain why it moved.
Frequently asked questions
What does SoLV stand for and what does it measure?
SoLV stands for Share of Local Visibility. It measures the percentage of grid points where your business appears in the top three positions of the local Map Pack. Because top-3 is where the majority of clicks go, it is the single clearest number for whether your local SEO is working.
How is SoLV different from average rank?
Average Rank Position (ARP) tells you where you sit on average across all scan points, which is useful for direction. SoLV tells you what fraction of the market actually sees you in the clickable top-3. A business can have a decent average rank but a low SoLV if it is clustered in positions 4 to 10, which is exactly the gap ARP alone hides.
What is a good SoLV score?
There is no universal number, and it depends on how many competitors share the Map Pack. What matters is the trend on an identical grid. A SoLV that is rising month over month, measured on the same size, center, and spacing, is the signal to report. A high number that you cannot reproduce on the same grid is not a meaningful benchmark.
Can I compare SoLV between different grid sizes?
No. A 5x5 and a 9x9 sample the market at different densities and different points, so their SoLV numbers are not comparable. Freeze one grid size per project and compare scans over time on that same grid.
Should I use SoLV or average rank when reporting to a client?
Lead with SoLV as the headline number, then use average rank and the heatmap to explain the movement. The map shows where you are strong or weak, SoLV gives the headline, and the per-keyword leaderboards show who is moving. Present the map next to the number so the client can see both the shape and the scale of the change.
Keep reading
How to Track Google Maps Rankings Over Time Without Fooling Yourself
Most rank trends lie a little. How to track local Map Pack rankings over weeks and months so the change you report is real: one rank definition, identical grids, one engine, and the right views.
How to Present Heatmaps to Clients for Local SEO Reporting That Retains
Turn geo-grid scans into client reports that survive procurement meetings, the five-slide structure, which numbers to lead with, and the mistakes that make heatmaps feel like decoration.
Why Geo-Grid Tools Show Different Results
Two geo-grid tools, two different rankings for the same business, why that happens, when it matters, and how to sanity-check any grid data before you act on it.