
Reading scan history
How the project page's Scan History works: map rank, like-for-like changes, the Keywords, Timeline, and Runs views, filters, and bulk actions.
Updated
Every scan a project runs is kept on the project page under Scan History. This page explains what the numbers mean and how to use the three views. It describes GeckoGrid 3.7.0 and later.
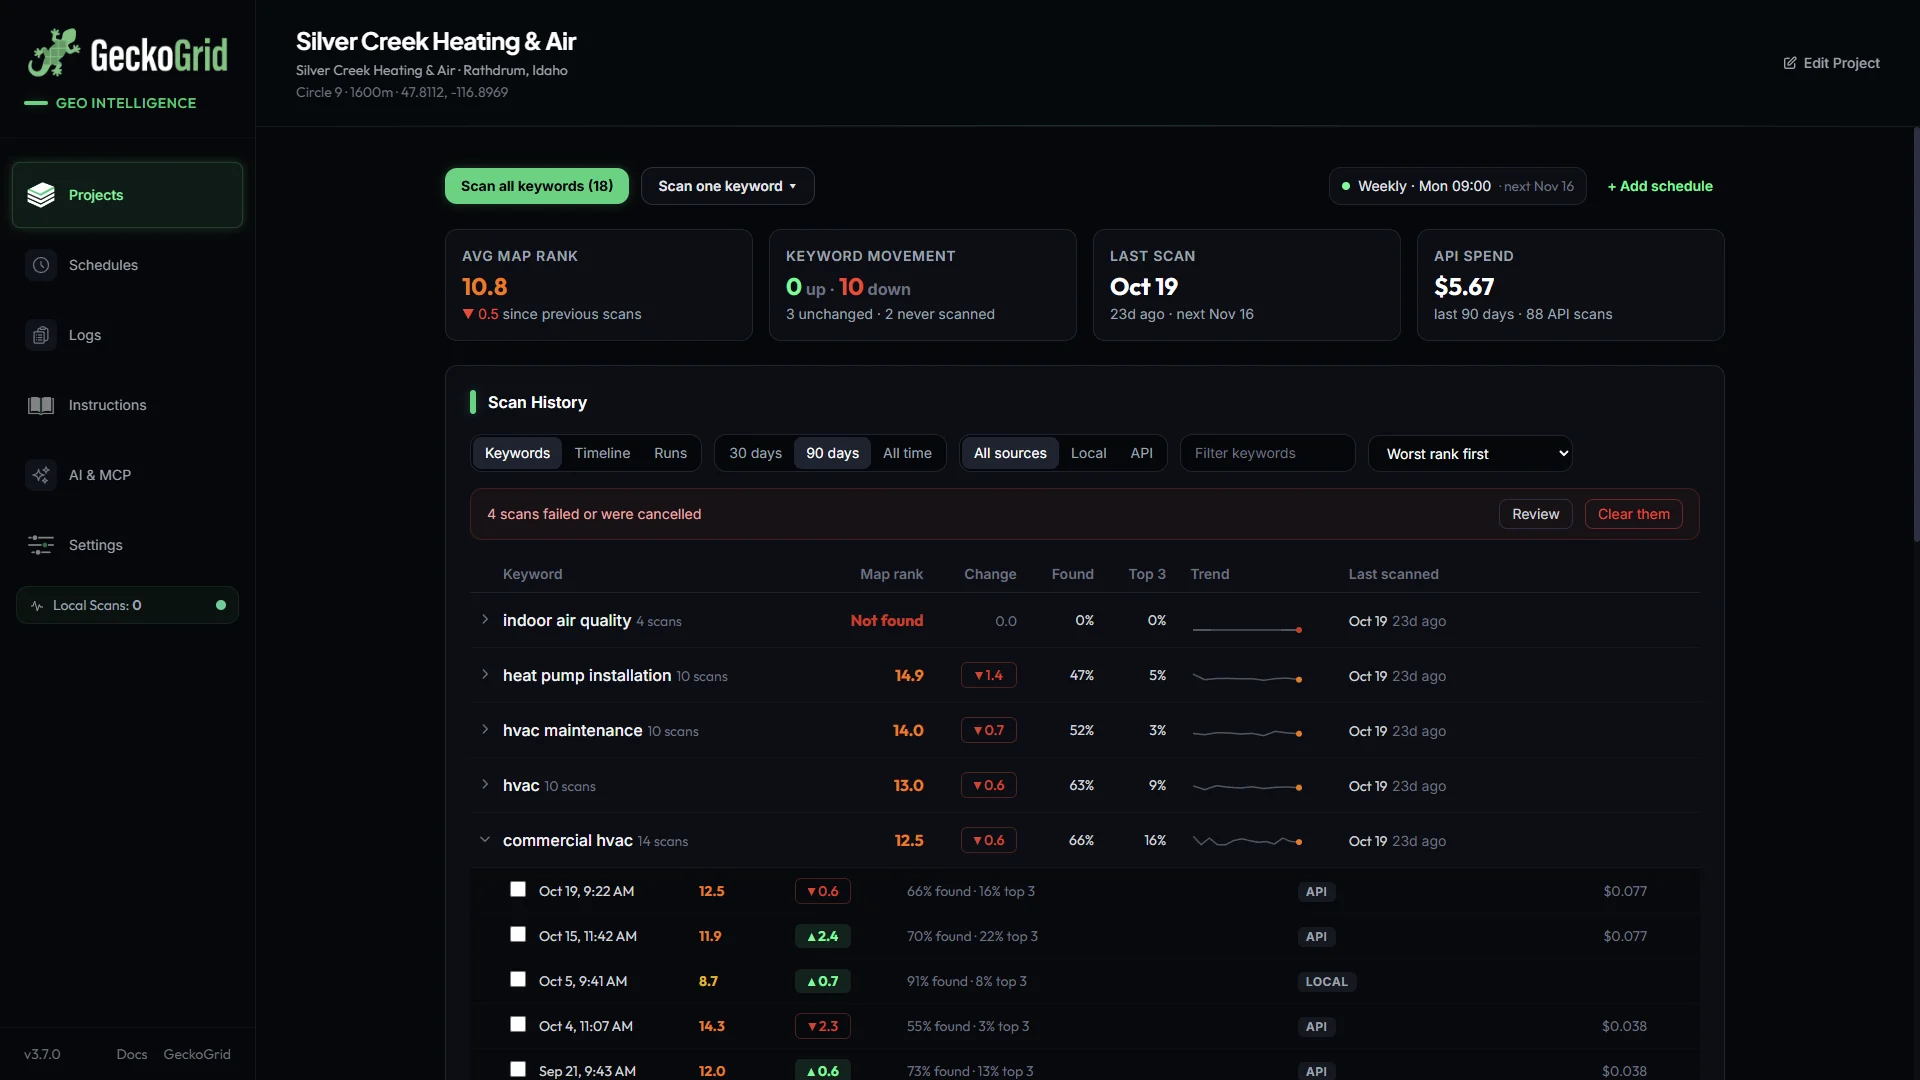
The top of the project page
- Action bar. Scan all keywords and Scan one keyword start scans. Each schedule on the project shows as a chip with its next run; click a chip to edit it, or + Add schedule to create one. While a scan runs, the bar turns into a progress strip with View live scan and Cancel.
- Stat cards.
- Avg map rank: the average of each keyword’s latest map rank, with how it moved since the previous scans.
- Keyword movement: how many keywords went up, down, or stayed level, and how many have never been scanned.
- Last scan: when the newest scan finished and when the next scheduled one runs.
- API spend: what API scans in the selected date range cost. Projects without API scans show their scan count instead.
Map rank: one definition everywhere
Map rank is the average rank across every grid point, where a point that did not find the business counts as 20. It is the same number as the Avg rank on the heatmap. A keyword that was not found at any point reads Not found.
This matters because the alternative, averaging only the points where you were found, rewards disappearing. A keyword that drops off half the grid would show a better average. Counting not-found points as 20 makes a drop look like a drop.
Changes compare like with like
The Change column compares a keyword’s newest scan with its previous scan on the same grid and the same source:
- Same grid means the same spacing and the same number of points. If you resize a project, the first scan on the new grid shows Grid changed instead of a number, because the two averages are not measuring the same area.
- Same source means Local compared with Local and API with API. The two engines can see slightly different results, so mixing them makes a trend line zig-zag.
A green ▲ is an improvement (the rank number went down). A red ▼ is a drop. Changes under 0.05 read as unchanged.
The three views
Keywords
One row per keyword: map rank, change, Found (the share of grid points that found the business), Top 3 (the share of points ranked 1 to 3), a trend line on a fixed 1 to 20 scale, and when it was last scanned. Each row has Open map (the latest heatmap) and Rescan. Click a row to list that keyword’s scans, each with its own change, source, and cost.
Keywords on the project that have never been scanned appear at the bottom with Scan now. Keywords that have scans but were removed from the project are labelled Removed from project.
Sort the list with Worst rank first, Best rank first, Biggest drop, Biggest gain, Least recently scanned, or A to Z.
Timeline
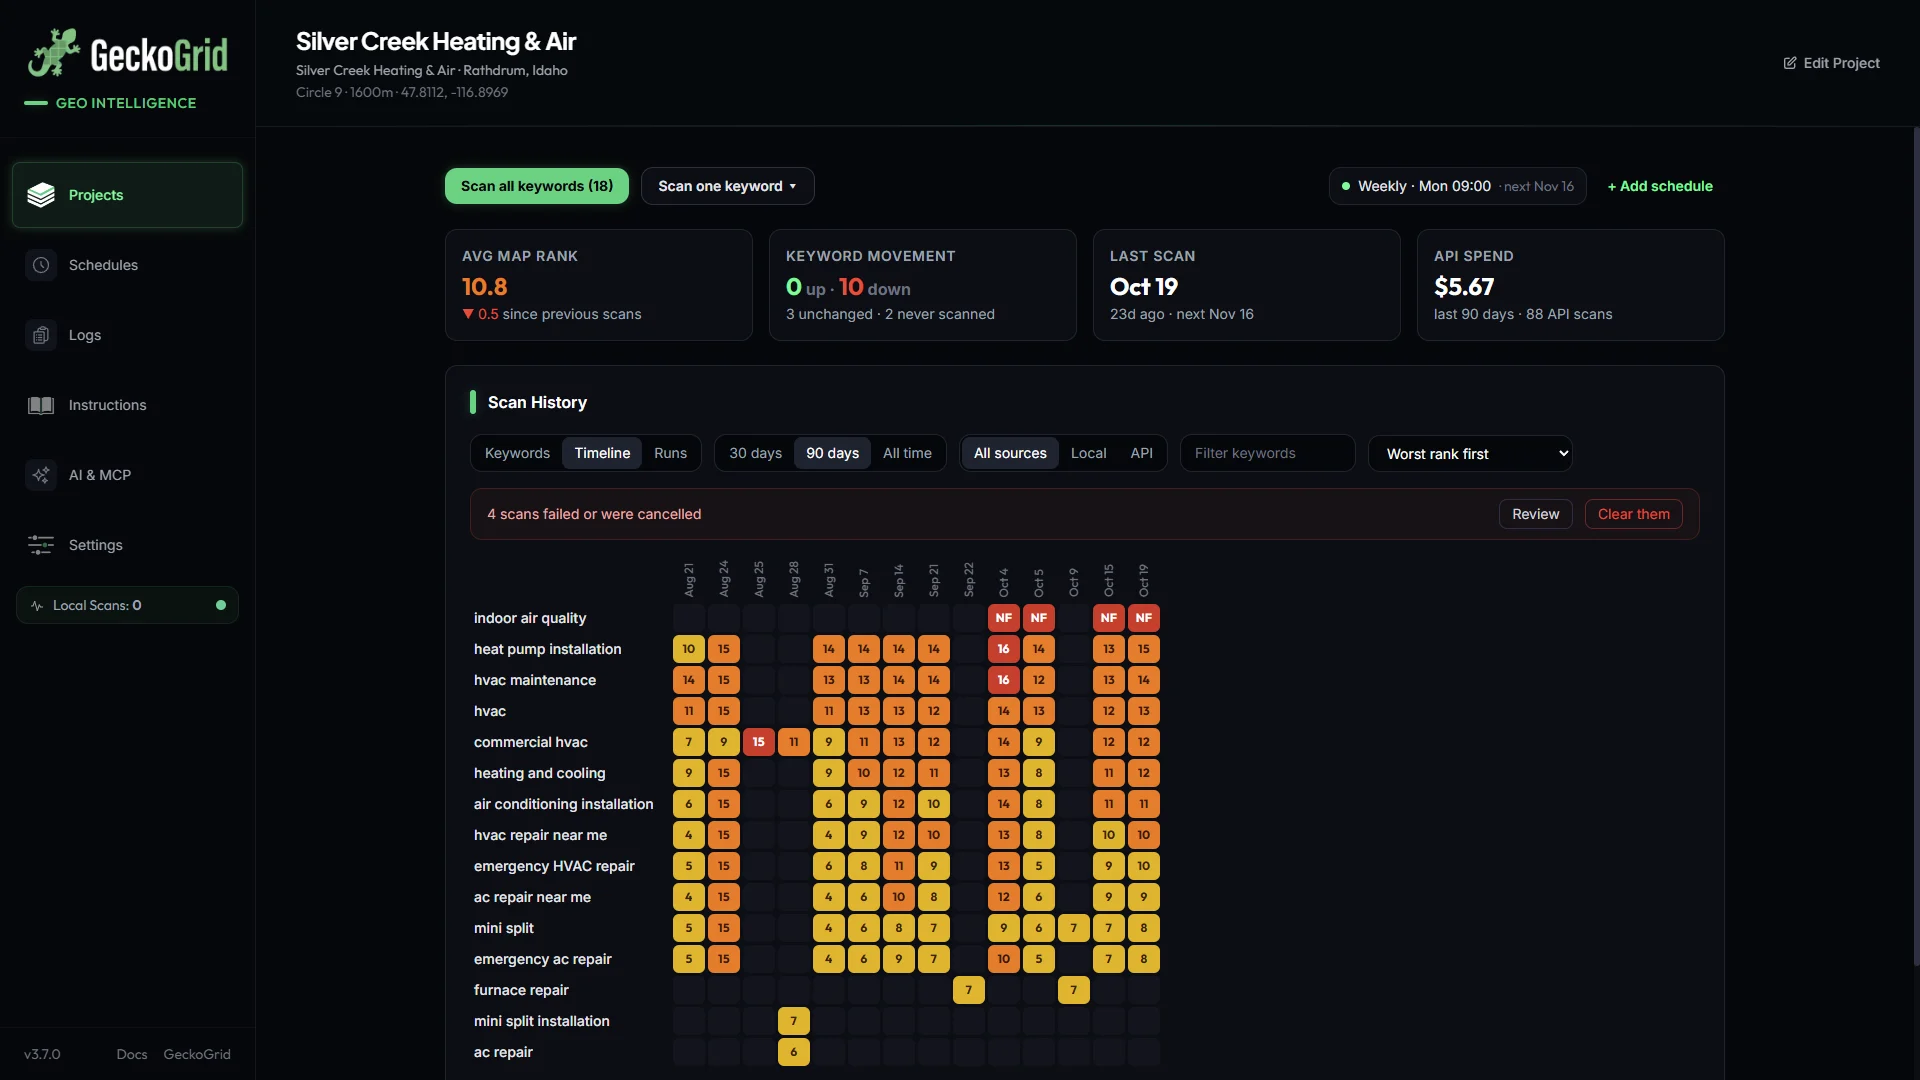
Keywords down the side and scan dates across the top. Each cell is that day’s map rank in the heatmap colors, and NF means not found. Click a cell to open that scan. This is the fastest way to see which keywords are slipping across a whole project.
Runs
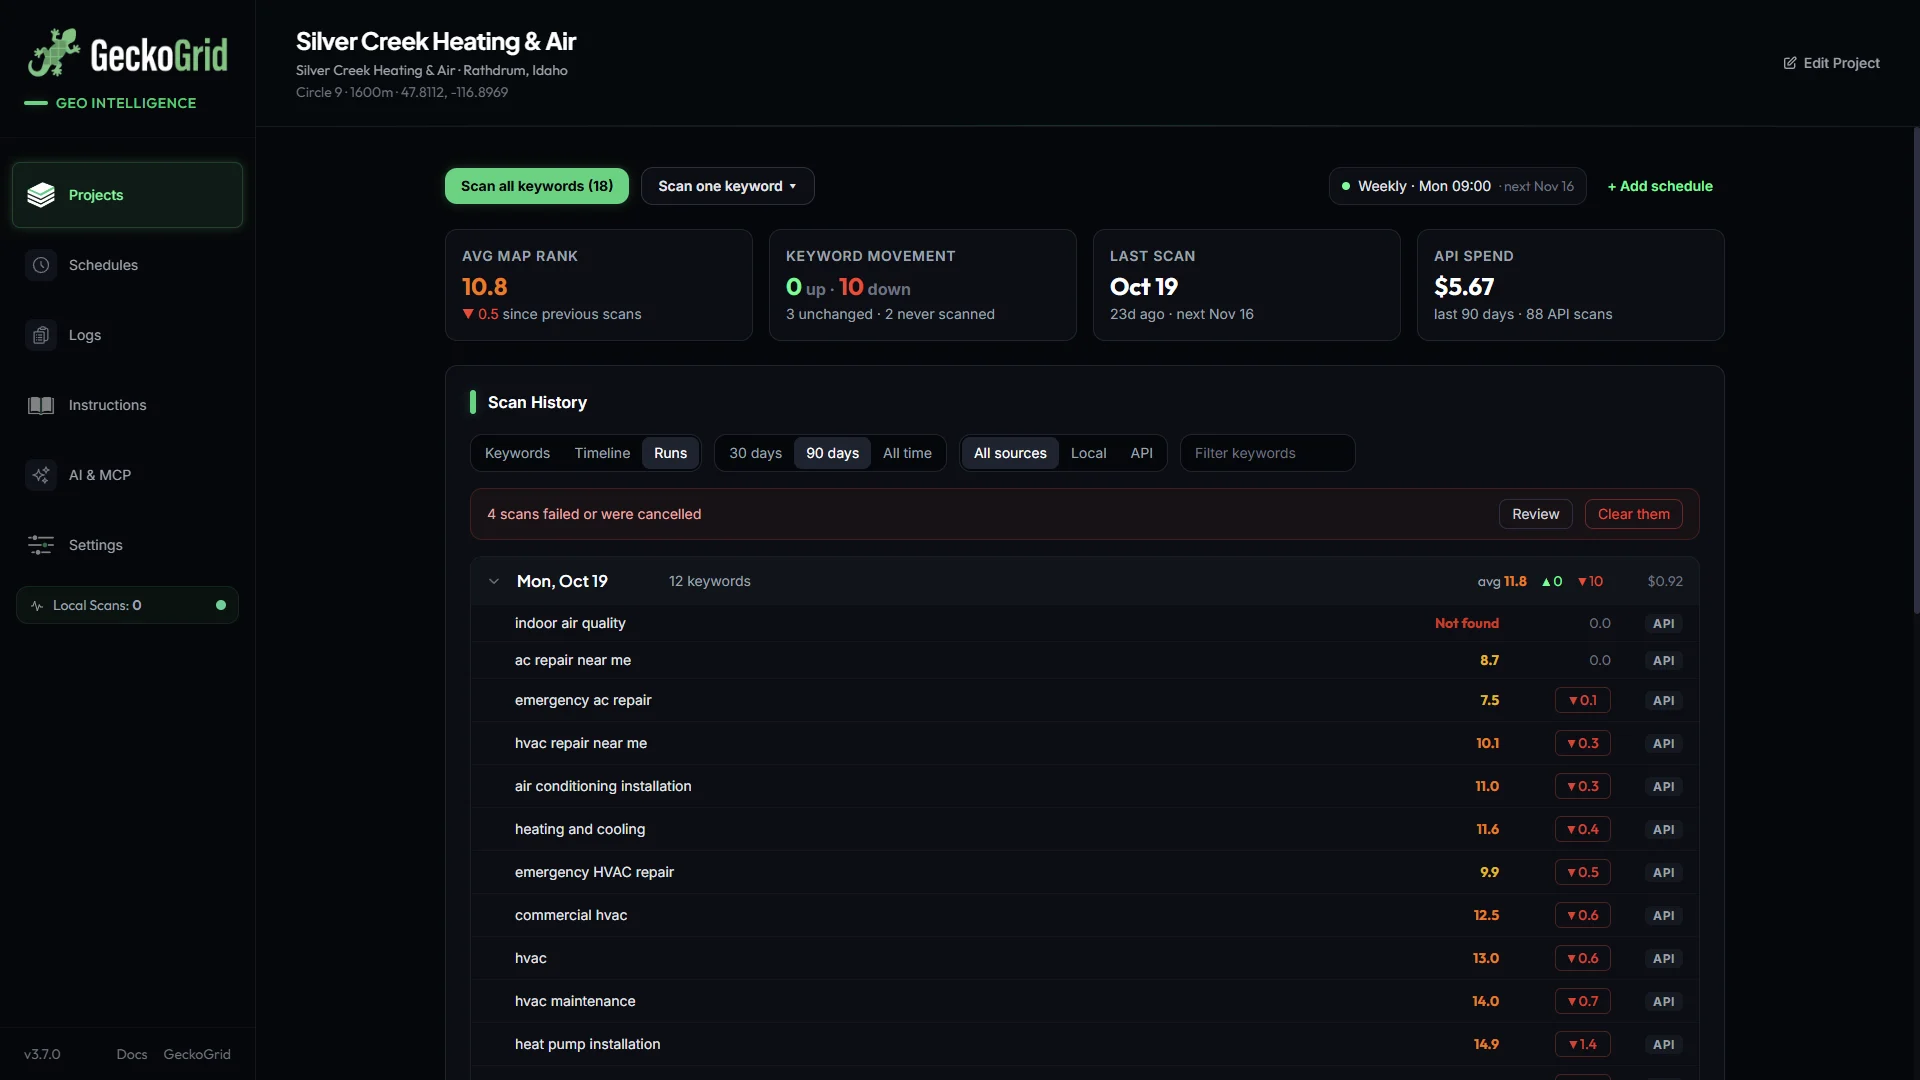
Scans grouped by day, newest first. Each run shows how many keywords it covered, the average map rank, how many keywords improved or dropped, and what it cost. Runs started by a schedule are tagged Scheduled, and runs started by an AI agent are tagged Agent. Expand a run to see every keyword’s rank and change.
Filters
- Date range: 30 days, 90 days, or all time. Projects with no scan in the last 90 days open on all time.
- Source: all sources, Local, or API. Shown only when a project has both kinds of scan.
- Filter keywords: narrows every view to matching keywords.
The view, date range, source, sort, and expanded keywords are remembered for each project.
Failed scans and bulk actions
Failed and cancelled scans are collected into one notice above the list instead of mixing into the history. Review lists them (each opens the scan), and Clear them deletes them all after a confirmation.
Tick the checkbox on any scans in an expanded keyword to Export CSV (one file with every selected scan’s grid points, saved to the project’s folder in your export folder) or Delete them together.
To delete one scan, use the trash icon on its row. It disappears at once and a notice offers Undo for a few seconds.
Related: your first scan, scheduling recurring scans, and exporting results.
Was this helpful?